|
IS THE GOLD WINDOW OPENING UP AGAIN?
Robert Lutts, President and CIO
Les Satlow, CFA, Portfolio Manager
December 31, 2007
It was a crime to possess gold from 1933 to 1975.
It may be a crime NOT to invest in gold from 2007 to 2010.?/em>
INTRODUCTION
Gold investors suffered 20 punishing years of weak price performance (see Spot Price of Gold?chart), with the price of a troy ounce falling from a hysteria-driven peak of $870 an ounce in 1980 to a dot-com boredom price of about $250 in 1999. Meanwhile, the stock markets benchmark, the S&P 500, chalked up 15% annual returns from 1980-2001, while golds annual return over the same period was a loss of about 2.5%.
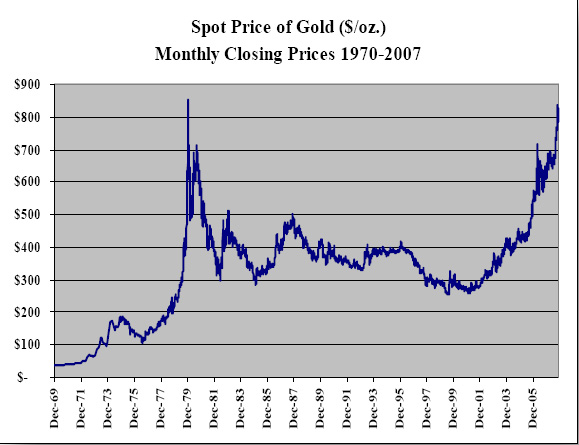
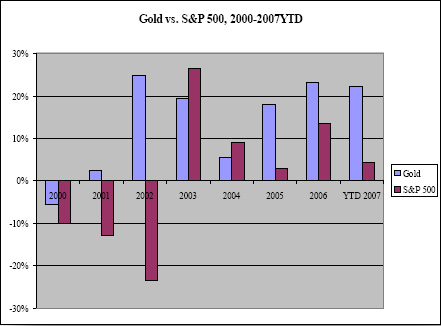
However, since bottoming out in 2001, gold has turned in a shining performance over the past six years, with the spot price rising more than 300% to $784 at the end of November, 2007, or about seven times the S&P 500 return over the same period (including dividends).
This paper briefly discusses the supply and demand fundamentals for the physical asset ?gold. We argue that there is likely to be strong demand for the foreseeable future, driven by the rapid increase in demand for gold as a viable asset class and by the gradually rising consumption demand in the Emerging Markets. Global production will take five to ten years to increase output materially, aside from a one-time jump in 2006. The most prominent risk to this scenario will come from the elasticity curve: higher prices could hamper demand growth. We witnessed this elasticity effect on the jewelry demand in India in 2006 (see more detailed elasticity discussion below). In addition, should the Emerging MarketsIndia and China in particularfalter, demand would fall significantly.
SUPPLY AND DEMAND
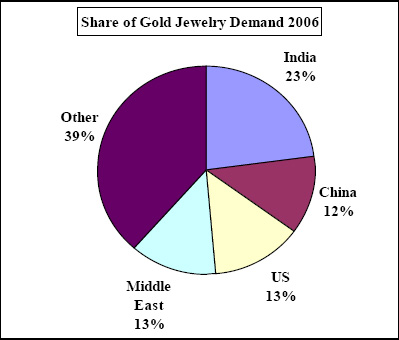
According to the World Gold Council (WGC), global demand for gold in 2006 was 3,386 tons, which is slightly lower than the 3,556 tons of supply that came on the market during the year. What makes the supply/demand fundamentals of the gold market so interesting is the breakdown (see Supply and Demand?charts). The vast majority of usagemore than two thirds of the bullionis for jewelry. And what many investors dont realize is that the leading jewelry consumer for gold is not the US, but India, which alone accounts for over 20% quarter of all gold jewelry sales. America comes in second, followed by China, Turkey, and Saudi Arabia. These trends are discussed in greater detail below.
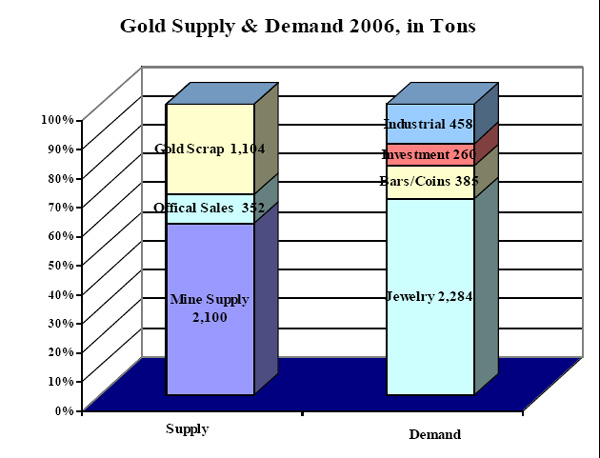
Of the 3,556 tons of supply, mines supplied about 2,100 tons, which represents over 90% of production levels seen in 1997. The remainder of the supply comes from the official sectorcentral banks selling into the marketas well as gold scrap sales.
By contrast, consumption of tonnage in 2006 was 3,386, down 20% from 1997. This is due primarily to lower demand from China (and the rest of Asia) and the Middle East following the Asian financial crisis and very low oil prices in the late 1990s. This has begun to turn around somewhat over the past three years, with estimated jewelry demand growing in China by 22% from 2003 to 2006. The Middle East jewelry demand, however, declined by 13% in the same period. In the recent history, 2004 was a noteworthy year, in that demand outstripped supply by 162 tons. Were it not for strong central bank selling, the imbalance would have been much more severe. The situation was the same in 2005 and 2006: without central bank gold sales, demand would have outstripped supply by 470 and 181 tons, respectively.
Not surprisingly, South Africa is the lynchpin of global supply: according to the US Geological Survey, the country holds 40% of the worlds 90,000 tons of underground gold reserves, and produces about 350 tons a year, or 15% of global output. Following South Africa are the US, Australia, and China. However, output is slow to increase: mining is extremely labor and capital intensive, and requires significant regulatory hurdles before full-scale production can come online. In addition, low levels of capital investment over the past ten years will limit the industrys ability to ramp up production in the immediate future.
A CLOSER LOOK AT DEMAND: Surging Consumption and Investment Interest There are two major drivers of demand that we would like to highlight: growing wealth in the Emerging Markets (EM) and the Asset Class Revival?effect.
Emergiing Markets?Demand: In Jeopardy? As mentioned above, Emerging Markets?demand for jewelry over the long term should in theory help the global growth for gold, although in the short term the higher physical price will take a toll on tonnage demand. The Share of Gold Jewelry Demand 2006?pie chart illustrates the dominance of India, China, and the Middle East (where Turkey and Saudi Arabia dominate), which together consume half the worlds jewelry gold. The blistering growth rates of those countries, as well as their deep cultural affinity for gold, have combined to produce a three-year (2003-2006) annual demand growth rate of 8% in China and 11% in India in spite of soaring bullion prices.
In addition, the Chinese government began to liberalize its control over gold production and sales in 2003, allowing foreign companies to enter the market with Chinese partners and sell gold. The US embassy in Beijing noted in a 2003 brief that this would stimulate gold sales in the country and ease the shortage of gold supply for jewelry in China.?Indeed, from 2002 to 2006, jewelry consumption increased from 235 tons to 275 tons, a jump of 17%.
The Middle East is another area that investors need to watch carefully as a barometer of gold demand. The per capita jewelry demand in the Gulf (i.e. oil exporting) states is dramatically higher than in the Westthe UAE in 2002 consumed 31 grams per capita, versus 1 gram per capita for the US, for instance (Dubais nickname is the City of Gold?. The region as a whole (including Turkey) accounted for 13% of global jewelry demand in 2006. With oil prices at current levels, it is reasonable to assume that a healthy portion of an increasing mountain of petrodollars?will find its way from black gold?into yellow gold.?/p> Of course, it should be noted that gold demand will be very sensitive to economic conditions in the emerging markets. Asian consumers responded to their collapsing markets in 1997-1998 by dramatically reducing their consumption of goldtotal Southeast Asian jewelry demand fell a whopping 46% in a one-year period. Turkish demand fell 34% during its crisis in 1998-1999. During 2002, a poor monsoon season and higher gold prices in India resulted in a sharp decline in jewelry demand (gold down 20% year-on-year).
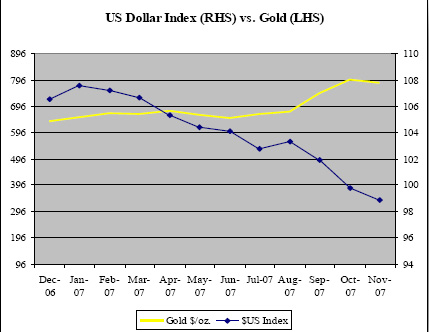
In addition, the price of gold itself clearly depresses ?and has depressed ?demand: jewelry demand in 2006 fell 16% from 2005 and was 29% lower than the comparable 2000 figure. This should not be surprising, since the dollar price of gold rose 134% over the 2000- 2006 time period and the laws of economics dictate some sort of demand destruction response. The gold price, which has been exacerbated by a sharply deteriorating dollar versus most foreign currencies, has risen less in most currencies than in dollar terms (only half as much in euros as in dollars!), but marginally so in India and China, whose yuan currency is tied to the US dollar for now.
Investment Demand: Back in Business. Gold as an investment is where all the excitement is these days. As an individual asset class, gold is gaining attention but still is largely neglected. Typically, major Wall Street houses lump it into either the Basic Materials sector (mining stocks) or in the hard assets?category, which mostly favors Commodities like oil and gas, and real estate.
However, there is a case to be made for the inclusion of gold as a class on its own. Gold has a correlation coefficient of 0.008 to the S&P 500 from 1976-2005, indicating that there is no meaningful correlation at all between the two, and therefore provides a powerful tool for risk-reducing asset allocation within at least the two-asset-class framework. The metal also benefits from the perception that it will gain value in an environment of inflation or US dollar depreciation, or geopolitical instability. So, far during this current cycle, then, it appears to be functioning according to the playbook.
Given the strong performance of gold and precious metals over the past five years (the Philadelphia Gold and Silver Index posted a 133% return from 2000-2006), capital flows are likely to continue to enter the segment, creating a possible snowball effect given the relatively small size of the investable gold market.
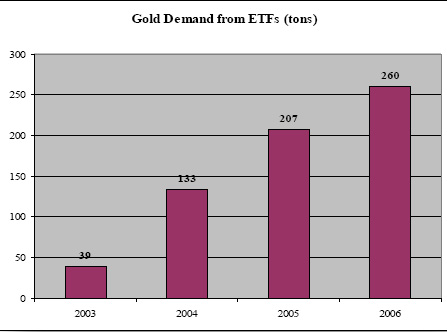
Perhaps the best example of this is the meteoric rise of the two exchange-traded funds that track the price of gold bullion, the StreetTracks Gold Trust and the iShares Comex Gold Trust. StreetTracks launched in November 2004 with $13 million in net assets: by December 2007, the ETF reported that its assets had exceeded $15 billion. The latecomer iShares gold ETF launched in January 2005 with $6.4 million in net assets, and as of December 2007 has $17.6 billion.
Now lets put it all together: weve got falling demand for jewelry in recent years due to the higher price of the bullion, and soaring demand from investors seeking shelter from a weak US dollar.
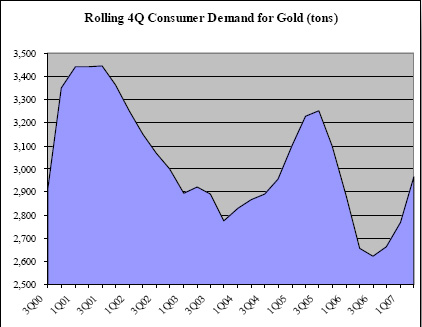
Thus we illustrate the paradox of gold prices from a supply and demand perspective. As the price of the bullion rises, demand for consumption is likely to be restrained, keeping overall consumption down. On the other hand, higher gold prices attract hordes of investors seeking the metal for the reasons mentioned above. Our analysis shows that there is a 60% correlation between the change in investment tonnage and the price of gold over the past seven years. Recent data from the third quarter of 2007 also supports this thesis: investment demand skyrocketed 72% from a year ago, as the price of bullion rose 14% during the quarter alone and the dollar sank over 5% against the euro.
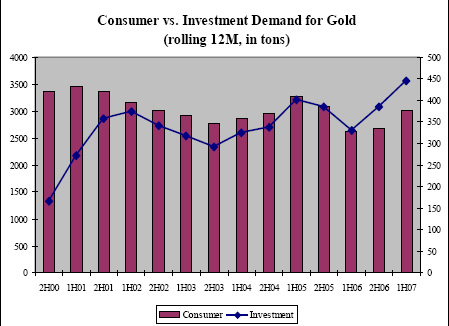
For now, jewelry remains the dominant determinant of demand, and is likely to remain so for the foreseeable future, given that is nearly 90% of overall demand. Still, our belief is that there could be a groundswell of demand from the investment community for exposure to the physical commodity. It may surprise many investors to learn that gold bullion has outperformed?the S&P 500 in the past six.
Consider the following scenario: frustrated with lackluster and increasingly volatile US equity large-cap returns, US stock funds make a miniscule shift into gold, say 0.1% of their $7 trillion in assets. This translates into $7 billion in additional assets scrambling to be deployed into gold. At current levels, that would represent an increase of about 10% in global demand for bullion. Bearing in mind that $1 billion represents about 47.3 tons of gold (at $800/troy ounce), and that mines produce only 2,500 tons per year, the math becomes very simple: every $5 billion in new investment demand for bullion will soak up nearly 10% of total annual mine production, which struggles to pull more gold out of the ground in the best of times.
So, why will the demand for gold as an investment class rise? Two reasons: first, it has tacked on spectacular investment performance over the past seven years. That alone is usually sufficient to attract droves of investors who chase performance. The second reason is related, but more suitable to long-term investors: the main US equity benchmark, the S&P 500, has recouped much of the lost ground from 2000- 2002, but no longer has the post-recession earnings acceleration to drive share prices much higher in many areas of the equity market. A sustained sideways large-cap equity market will leave investors no choice but to seek as many substitute asset classes as possible in their quest for higher returns.
GOLDMINES OF INFORMATION
1) World Gold Council. An industry-sponsored site that offers a wealth of information on supply and demandstatistics for gold, as well as informative discussions on gold-related topics ranging from history to how a gold mine operates. www.gold.org
2) Goldsheet Links. A good source to track the price of gold and other metals, as well as a good starting point to investigate global mining companies. www.goldsheetlinks.com
3) US Geological Survey. www.minerals.usgs.gov/minerals/pubs/commodity/gold The home page of the Gold Section of the USGS. Useful statistics on gold production and a link to the monthly Gold update report (for a list of all mineral surveys, go to: minerals.usgs.gov/minerals/pubs/commodity/mis.html
4) The National Mining Association. www.nma.org/statistics/pub_gold_silver.asp Poorly updated, but links to an interesting interactive gold price chart: www.nma.org/enumerate/gold/gold.htm
5) The Gem & Jewelry Export Promotion Council. Industry-sponsored web site with good statistics on the state of the global jewelry import/export business.www.gjepc.org/gjepc/gjepc.aspx?inclpage=Uinfo_St_StatisticsЁьion_id=6"
[size=-1]The views expressed represent the opinions of Cabot Money Management and are not intended as a forecast, a guarantee of future results, investment recommendations, or an offer to buy or sell any securities. There can be no guarantee that Cabot Money Management will select and hold any particular security for its client portfolios. Earnings growth may not result in an increase in share price. Past performance is no guarantee of future results. Any advice or suggestions are provided for informational purposes only and is not a solicitation to purchase any investments or services described herein. Please consult your advisor to determine if an investment strategy is appropriate for you. Past performance of either the domestic or international markets or any specific investments is not predictive of future results nor will diversification alone protect from loss.
|


 ЗЂБэгк 2008-10-13 17:05:43
 ЬсЩ§ПЈ
 жУЖЅПЈ
 БфЩЋПЈ