|
|

楼主 |
发表于 2007-8-26 21:37:54
|
显示全部楼层
Oil Market Update
Oil Market Update August 21st, 2007
In the last update we predicted the failure of the intermediate uptrend in crude a day before it occurred, on the basis of analysis of COT data coupled with severe deterioration in oil stock prices. The action in oil stocks presaged the breakdown in oil itself and right now, with oil stocks showing signs of bottoming, they look set to presage an intermediate reversal in oil again.  On the 1-year chart for Light Crude we can see the breakdown early this month, which followed an unbroken 2-month uptrend. However, this is certainly a bullish looking chart overall, with the price advancing away from a large, irregular Head-and-Shoulders bottom. The fact that the intermediate uptrend failed early this month is hardly surprising after a steep 2-month uptrend that took the MACD indicator shown at the bottom of the chart to a level indicating a very overbought condition. Following the breakdown the price has reacted back to the $70 level where it has been finding 搑ound number?support, although substantial support only comes into play around the $67 level, and the current rather large gap between the 50 and 200-day moving averages indicates a strong probability that the price will react back towards this level, although it may not get that far before the new uptrend begins. Thus, crude is viewed as a buy in coming weeks on further decline towards the $67 area. On the 1-year chart for Light Crude we can see the breakdown early this month, which followed an unbroken 2-month uptrend. However, this is certainly a bullish looking chart overall, with the price advancing away from a large, irregular Head-and-Shoulders bottom. The fact that the intermediate uptrend failed early this month is hardly surprising after a steep 2-month uptrend that took the MACD indicator shown at the bottom of the chart to a level indicating a very overbought condition. Following the breakdown the price has reacted back to the $70 level where it has been finding 搑ound number?support, although substantial support only comes into play around the $67 level, and the current rather large gap between the 50 and 200-day moving averages indicates a strong probability that the price will react back towards this level, although it may not get that far before the new uptrend begins. Thus, crude is viewed as a buy in coming weeks on further decline towards the $67 area.  The COT chart shows the extreme Commercial short position early this month that enabled us to predict the breakdown in crude. There was an element of luck in this as these figures are deliberately released late to keep ordinary investors in the dark - in this case the market obligingly didn抰 plunge until several days later. Not surprisingly, the Commercials short position has since dropped considerably as the price has gone into retreat, although it is not yet at a level that signifies that the time is ripe for a new uptrend to begin. We won抰 know, of course, what level the Commercial short position dropped to on the plunge into Thursday until this Friday, of course. Thus, it is considered likely, given in addition the location of the next important support level in the $67 area, and the large gap between the 50 and 200-day moving averages, as mentioned above, that oil will drift somewhat lower in coming weeks towards, but probably not reaching, $67, even if oil stocks have already bottomed as suspected. The COT chart shows the extreme Commercial short position early this month that enabled us to predict the breakdown in crude. There was an element of luck in this as these figures are deliberately released late to keep ordinary investors in the dark - in this case the market obligingly didn抰 plunge until several days later. Not surprisingly, the Commercials short position has since dropped considerably as the price has gone into retreat, although it is not yet at a level that signifies that the time is ripe for a new uptrend to begin. We won抰 know, of course, what level the Commercial short position dropped to on the plunge into Thursday until this Friday, of course. Thus, it is considered likely, given in addition the location of the next important support level in the $67 area, and the large gap between the 50 and 200-day moving averages, as mentioned above, that oil will drift somewhat lower in coming weeks towards, but probably not reaching, $67, even if oil stocks have already bottomed as suspected.  Oil stocks are a rather different story. Just as they topped out before crude, they appear to be bottoming out before it now. We exited most oil stocks too early on the preceding intermediate uptrend which took prices to the upper limit of expectations. Actually they exceeded our best expectations by hopping above the uppermost return channel line on the 2-year OIX oil index chart shown, and as is customary when this happens, they then did a rapid about face and plunged - but at least that meant we weren抰 around by the time this happened. As we can see oil stocks have now fallen into the target zone given in the last update, where it was stated that the drop should take the index at least back to its 200-day moving average, and possibly back as far as the lower channel line, currently at about 655. Last Thursday抯 dramatic Reversal Day in this index and in the broad stockmarket signifies, however, that the low is probably in - this low being the intraday low on Thursday, which the index may approach again in coming days and weeks, presenting a better buying opportunity. As usual, would be buyers face the conundrum of buying now, or angling for better prices in the weeks ahead that would be presented by a retest of the lows, and thus risking missing an upside breakout in the meantime. This dilemma is considered best handled by partial purchases around current levels and completion of buying on a dip should it occur. One final point - oil is the lifeblood of the modern world, and barring an all-out market crash, which doesn抰 look likely despite recent jitters, oil companies generally, and especially large oil companies, which are relatively immune from the risks afflicting smaller companies, can be expected to continue to do well. This means that the inevitable periodic corrections in large oil stocks such as we are now seeing present windows of opportunity for investors to take positions in these stocks, which in addition to their growth potential, also pay good dividends. Oil stocks are a rather different story. Just as they topped out before crude, they appear to be bottoming out before it now. We exited most oil stocks too early on the preceding intermediate uptrend which took prices to the upper limit of expectations. Actually they exceeded our best expectations by hopping above the uppermost return channel line on the 2-year OIX oil index chart shown, and as is customary when this happens, they then did a rapid about face and plunged - but at least that meant we weren抰 around by the time this happened. As we can see oil stocks have now fallen into the target zone given in the last update, where it was stated that the drop should take the index at least back to its 200-day moving average, and possibly back as far as the lower channel line, currently at about 655. Last Thursday抯 dramatic Reversal Day in this index and in the broad stockmarket signifies, however, that the low is probably in - this low being the intraday low on Thursday, which the index may approach again in coming days and weeks, presenting a better buying opportunity. As usual, would be buyers face the conundrum of buying now, or angling for better prices in the weeks ahead that would be presented by a retest of the lows, and thus risking missing an upside breakout in the meantime. This dilemma is considered best handled by partial purchases around current levels and completion of buying on a dip should it occur. One final point - oil is the lifeblood of the modern world, and barring an all-out market crash, which doesn抰 look likely despite recent jitters, oil companies generally, and especially large oil companies, which are relatively immune from the risks afflicting smaller companies, can be expected to continue to do well. This means that the inevitable periodic corrections in large oil stocks such as we are now seeing present windows of opportunity for investors to take positions in these stocks, which in addition to their growth potential, also pay good dividends. |
|


 发表于 2007-8-24 10:14:06

 提升卡
提升卡 置顶卡
置顶卡 变色卡
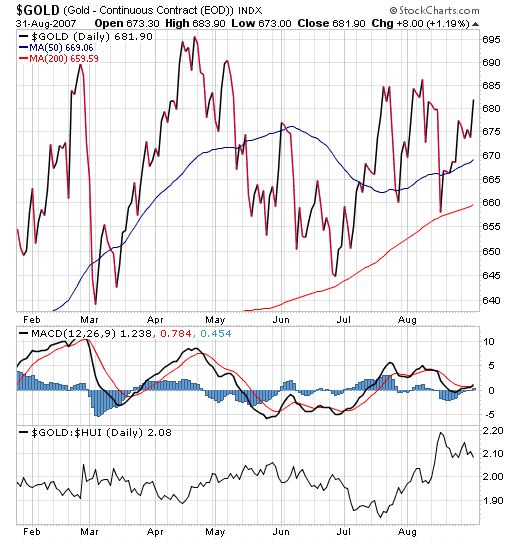
变色卡 Looking at the 2-year chart we can see how significant differences have emerged between gold and silver in recent times. Gold has been looking stronger than silver for months, and managed to break above the “Distribution Dome” shown - silver did not achieve this and paid the price last week when the Dome forced its collapse below an important support level. Gold remains within a tight range bounded by the important red support level shown at and above $635 and the strong resistance at and towards the April high approaching $700, and although it is believed to be in position to break higher soon for the reasons set out above, with the fundamental picture brightening rapidly in recent days, we should not overlook the potential Head-and-Shoulders top on the chart that has formed between February and the present. Our stops have been set below the March low at $635 for some time, and stops should continue to be set below this level, although holders should be aware that if it drops below this key level a rapid plunge is to be expected similar to that which occurred in silver last week when it breached its key support. That said gold looks good here and the Head-and-Shoulders danger will be negated by a move above the April high towards $700 which would likely mark the start of a breakout drive above last years’ highs at about $730. It is logical to suppose that gold will mark time for a while before it breaks higher to allow sentiment in beaten down silver to recover sufficiently to enable it to break back above its new resistance level in the $12 - $12.50 zone.
 Fortunately, nearby parameters are clearly defined. Conditions of extraordinary calm currently exist in the gold and silver markets - a calm which history and a battery of indicators suggest is not going to last much longer. We will now look at these conditions on 2-year charts for gold and silver, which we will compare and contrast. On these charts we can see that bearish 揇istribution Domes?have formed in both metals over the past year or so. These patterns are bearish of course because of the evident distribution - and remain so unless and until the price can break out above the top of the dome pattern. This has happened with gold but its breakout has been somewhat marginal and has not been confirmed by silver, which has tried to break out of its dome on a couple of occasions and failed. One danger with gold is that it may have broken out from its dome only to form the Right Shoulder of a Head-and-Shoulders top, with the Left Shoulder of the pattern having formed in February and the Head in April - May. Several technical factors are converging to suggest that a big move is in the offing - one is the steady narrowing of price fluctuations over a period of many months, reflected in the convergence of the MACD indicator on both charts towards the zero line. Another is the current tight grouping of the prices of gold and silver with their respective moving averages, which in the case of silver have flattened out, increasing downside risk. Another is the continued narrowing of the Bollinger Bands (not shown) that indicates a condition of tranquility that cannot be expected to persist for much longer. Looking at both charts we can see that the Domes on each of them are rapidly dropping back towards the critical support zones marked in red, so that we will see a breakout one way or the other soon. Put simply, gold and silver had better get on with and break out upside almost immediately - which they are still in position to do - to avert the risk of a plunge, which is what would likely follow failure of the red support zones. Our tactics are therefore clear. We remain long gold and silver for a prospective upside breakout - breakout meaning by gold above last year抯 highs at $730 and by silver initially above the Dome resistance line and then followed by a breakout above last year抯 highs - but will exit all positions in the metals in the event that gold breaks below its March lows at $635 and silver breaks below $12, which would take it below its January lows. Should the critical support levels fail, gold and silver can be expected to drop rapidly to the next important support levels shown.
  The scenarios sketched out for gold and silver closely relate of course to the tight technical situation that also exists in the US dollar. On the long-term dollar index chart we can see how the dollar is currently being forced into a corner between its long-term downtrend line and its crucial long-term support level, a situation that clearly does not have long to run, meaning that we can expect a breakout one way or the other soon. As long as the dollar remains below the downtrend line, it is being pressured to break down, and this is what we will expect to see. However, should it break out upside it is likely to rally steeply. The reason why there is a considerable risk of a steep short-covering rally in the event that the price breaks above the trendline is this: fundamentally it is hard to think of any good reasons to be long the dollar now, and this is the view that is widely held across markets, as a result of which short positions are running at a high level. Thus, if the dollar should succeed in breaking above the trendline it will trigger short-covering that could rapidly develop into a self-feeding meltup, and it goes without saying that this would be likely to coincide with breakdowns by gold and silver. Therefore our tactics with the dollar are that short positions should be immediately closed out in the event that it breaks above the long-term downtrend line, and long positions may be considered by speculative traders after it has gotten clear of the trendline. Note that after the meltup, the grim fundamentals would be expected to re-assert themselves and the dollar would go into retreat once more.
  Our general tactics with regard to Precious Metals stocks are to remain long whilst the chance of an upside breakout remains alive, but to drastically trim positions in the event that the critical gold and silver support levels fail. Alternatively this may be done when the red support level shown on the 2-year HUI chart is breached. This is thought likely to coincide with the failure of the gold and silver support levels - however, it may be the lower support level that fails at that time, meaning that the red level could give way sooner. Otherwise failure of nearby clear support levels on individual stocks may be used as a signal to exit, and in the case of smaller issues with ill-defined support levels, stop losses may be employed say 10% below their current prices.
 When we consider the 2-year gold chart further we can see that the price is above all of its principal moving averages, which are bunched together and rising - this is a most auspicious circumstance, particularly as the price is now getting clear of the dome, and while we must acknowledge the residual Head-and-Shoulders top danger, it is clear that gold is in position for a powerful upside breakout that should drive it clear above last year抯 highs to commence a major uptrend. Note the narrowing of price fluctuations in recent months, highlighted by the neutralization of the MACD indicator at the bottom of the chart - an unusual calm prevails of the kind that normally precedes the emergence of a major trend. The general background situation vis-?vis the broad stockmarket, inflation and interest rates and other factors having a bearing on the outlook for both gold and silver has been set out in the Silver Market update, to which readers are referred - silver got the star treatment in this round of updates on account of the rapid and extraordinary improvement in its prospects. This background situation is now strongly bullish. In conclusion an upside breakout is believed to be fast approaching for gold and it is thus viewed as a strong buy here, although it may back and fill for a little while longer as it waits for sentiment in silver to recover sufficiently for it to overcome its resistance at and towards $12.50.
 Before going any further it is worth considering the general background. The 揺nd of the world is nigh?crowd had a field day in August, getting high on the convulsions in the broad market, and their dire predictions have been given a good airing due to a sudden surge in media and public interest. This is not to deride the doom and gloomers or their work - there is a strong basis to their arguments, but according to the indicators we follow the wheel is not going to come off just yet. On the August selling climax the Put - Call ratio rose to an extreme normally associated with a market bottom. Volume indicators for the broad stockmarket remain decidedly bullish with Accumulation-Distribution and On-balance Volume pushing new highs over the past week or two, which given that the market is still well off its highs is quite an accomplishment. Insider buying has been running at a 4-year high, again hardly what you expect to see at the start of a bear market. Finally, the plethora of alarming articles in the mainstream media is what you expect to see at a market bottom. From all this we must conclude that the market is on its way up again and is likely to make new highs, even if some sectors such as house building and home improvement in the US continue to suffer the fallout from the fenced off mortgage crisis. An important point to grasp is that the reasons for the markets being able to recover stability and advance also happen to be bullish for gold and silver - the massive infusions of liquidity required to put the markets back on an upward path are of course inflationary, and thus good news for gold and silver, and the renewed prospect of falling interest rates makes gold and silver more competitive investments, and in addition the lurking risk of a major dollar breakdown perhaps brought on by falling rates would be a powerful additional driver for the Precious Metals. Thus we should see both the broad market and gold and silver advance in unison.
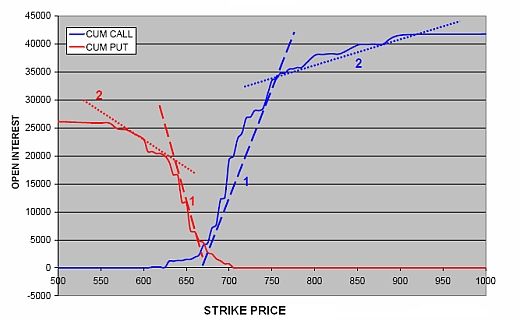
  We will now turn to consider the reasons why the plunge last month is regarded as having been a final capitulative flushout. One big reason is the current COT profile for silver, which is viewed as being VERY BULLISH. On the latest COT chart presented above, we can see how the Large Spec long positions, represented by the blue bars, have dropped to an extraordinarily low level, demonstrating that they have finally 搕hrown in the towel?in disgust and walked away. The Large Specs are the clowns of the marketplace, the fall guys who are always wrong and their unusually low level of interest in silver at this time is one of the surest signs you could hope for that silver is going up soon, and probably substantially. Conversely, the Commercials, who are never normally long silver, have greatly reduced their short positions as shown by the purple bars on the chart, to levels that suggest that a major rally is brewing. If you doubt the importance of these observations, then simply take a look at the latest